Understanding Sampling Methods
Correct sampling design is essential to ensuring that sample registration system (SRS) data will be regarded as a trusted data source at both the national and international levels. In a September 2025 webinar, Professor Agbessi Amouzou from the Johns Hopkins Bloomberg School of Public Health described the key elements of sampling design and sample size calculation. This is part of a monthly webinar series being conducted in 2025 for recipients of planning grants to develop SRS systems in African countries; other webinars are available on VIVA’s YouTube channel.
To access the slides, click “get the tools” in the upper right corner of this page.
Why care about sampling design?
In addition to maintaining data reliability, an appropriate sampling design will enable SRS to be representative at both national and subnational (such as province or district) levels. This will also allow for the calculation of confidence intervals around indicators derived from SRS data, and for the comparison of estimates between SRS and other datasets.
Key elements in sampling design
Designing the sampling approach requires understanding of the government’s health priorities as well as the potential users of the SRS data. It requires determining the level of representativeness of the sample (also called statistical domains), and the sample strata, or the groups within which an independent sample is drawn, must be identified. Another important consideration is to identify the smallest geographic sampling units (called primary sampling units or clusters), which might be census enumeration areas, villages, districts, or subdistricts. A complete sampling frame of the clusters, organized by the statistical domain, is needed; generally, this information is available at the National Statistics Office. A census frame is ideal as it is often complete and updated during a population census. It is also necessary to determine the sample size, sample selection procedures and sample weights.
Each of these concepts is discussed below:
Government health priorities and potential users of the SRS data
The government may have priority subnational areas that require frequent and more precise data for targeted health interventions or performance assessment. Similarly, other data users may have needs for the SRS data, such as partner organizations implementing large multi-year health programs. Another element of designing the system is to consider how it will link with existing systems.
Level of representativeness of the sample (statistical domains)
Statistical domains are the lowest geographic areas at which precise indicators will be generated. Some examples include regions and provinces. The challenge is that having more statistical domains results in a larger sample size and therefore higher costs.
Sample strata
Stratification can be used to ensure representation of some groups in your sample, especially minority groups that may not be picked in a non-stratified sample. Statistical domains may be used as strata. Stratification creates unequal probability samples, requiring the use of sampling weights.
Smallest geographic sampling units (clusters)
Clusters are the smallest sampling units within which a complete surveillance is established. This choice must be made based on the availability of the complete roster. Population census enumeration areas (EAs) offer more complete and rigorous sampling units; they come from the recent population census and generally contain 100-150 households. An advantage is that digital and sketch maps of EAs are often available at the National Statistical Office. EAs cover the entire country and are stable, however, they may cut across villages or communities. Other subnational areas, such as villages/blocks, districts/communes, and subdistricts, may also be used but can be unstable over time. It is essential that the clusters have clearly identifiable boundaries.
Data needed to develop the plan:
Complete sampling frame of clusters
As described above, a complete list of clusters is needed.
Sample size calculation
Drivers of sample size include:
Indicators to measure (such as mortality rates).
Statistical precision and domains (geographical level of precision).
Period of measurement for mortality indicators (may need to create estimates that span several years).
Government health priorities.
Budget.
More details about each of these are provided below.
Sample size: choice of indicators
Examples of mortality indicators include:
Crude death rate = annual deaths / mid-year population
Infant mortality rate = infant deaths / live births
Under-five mortality rate = under-five deaths / live births
Adult mortality rate = annual deaths (age 15-64) / mid-year adult population
Maternal mortality ratio = maternal deaths / live births
Cause-specific mortality rate = deaths by cause / target population
It’s best to choose an indicator that is likely to generate a large enough sample size that will measure most other indicators, but not too unrealistically large. Infant mortality rate is a good example. Once the sample size is computed, it is possible to calculate the precision of other indicators. The sample size must be computed for each statistical domain.
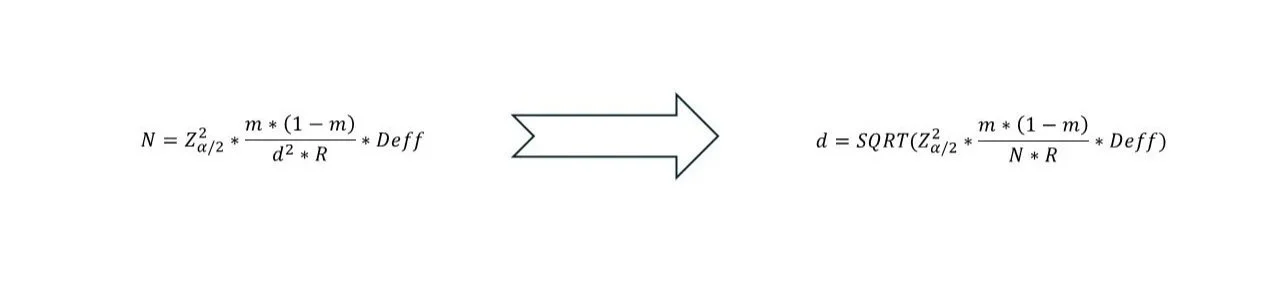
Sample size calculation
The formula for calculating sample size is given below.
• m = mortality rate (in proportion)
• d = absolute margin of error, ie. Confidence interval is m ± d
• R = household response rate
• Deff = Design effect (borrow from existing surveys, e.g. DHS)
• N is the target population corresponding to the indicator denominator (e.g., N is #births if using IMR). N must be converted into the corresponding total population and number of households